METHOD
How the data is captured: five steps, no paid provider
· 6 min read
Most App Store intelligence is a black box with a price on it. Ours is not, mostly because it cannot afford to be: there is no paid data provider anywhere in the chain, so every number has to be traceable back to something Apple published for free. This is the whole pipeline, in the order it runs.
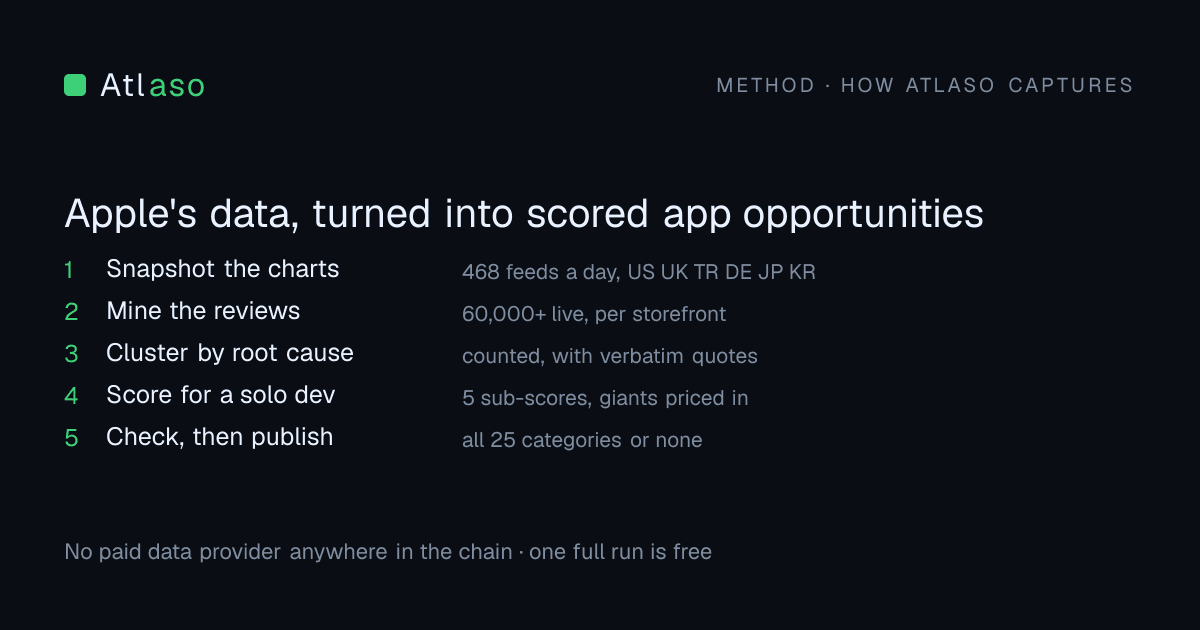
1. Snapshot the charts, every day
Apple publishes no historical App Store charts. None. Every chart-history tool, ours included, only has data from the day it started collecting, which means the archive is the product and a missed day is a hole nothing can fill later.
So we capture 546 chart feeds a day across US, UK, Turkey, Germany, Japan, South Korea and China, top 100 in every category, and never miss a day. It is Apple's own data, captured on a schedule. The one thing that can break it is Apple deciding we are asking too often, which is its own unpleasant surprise.
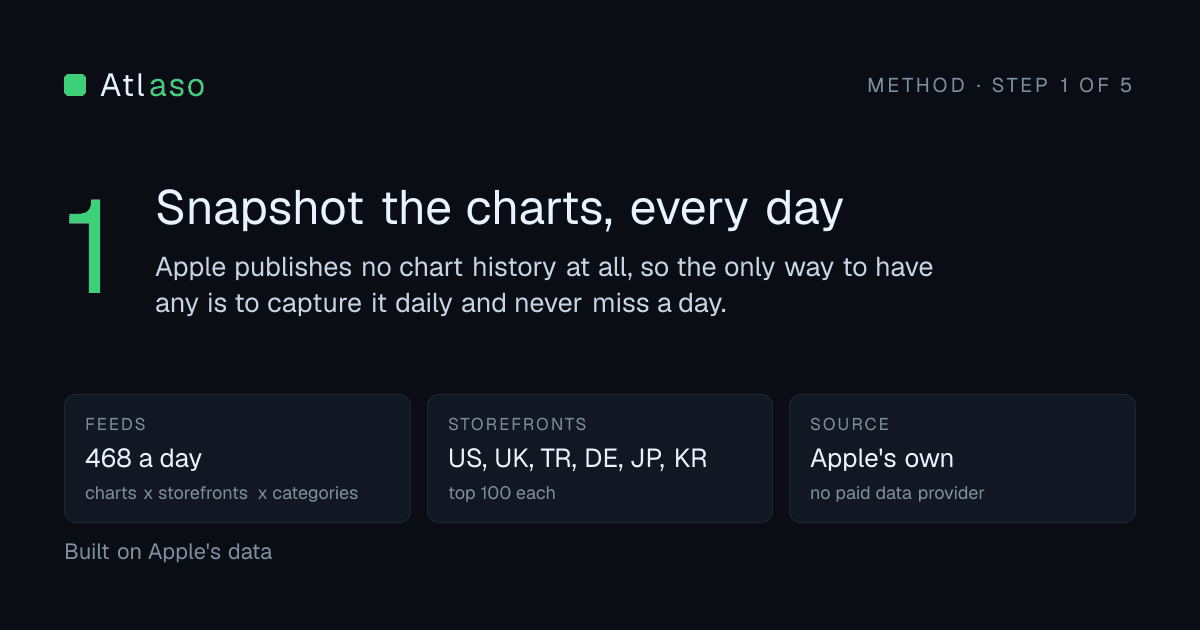
2. Mine the reviews of whatever is charting
A chart position tells you an app is winning. Its recent one and two star reviews tell you why people are leaving it. Those are different questions, and only the second one tells you what to build.
Every run reads roughly 200 recent reviews per charting app, per storefront, more than 60,000 live reviews in total. Per storefront is not a detail: Turkish users complain in Turkish about apps charting in Turkey, and that evidence never shows up in the US reviews of the same app.
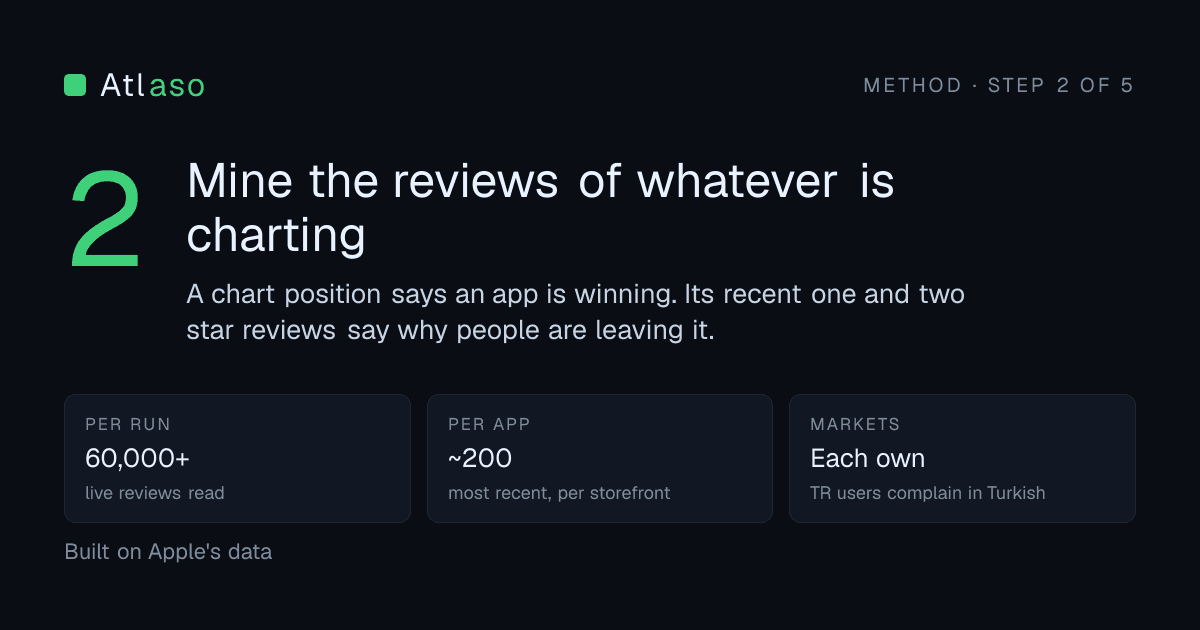
3. Cluster the complaints by root cause
“Crashes on launch since v5.2” and “won't open anymore” are one complaint, not two. Every run clusters the negatives by root cause and counts each cluster exactly.
That count is the whole point. A counted complaint is a specification you can build against; an uncounted one is a mood. An app only becomes a review opportunity if it clears a real gate: at least 25 recent one and two star reviews, and at least 25% of the sample. Below that, a handful of angry people is not a market signal.
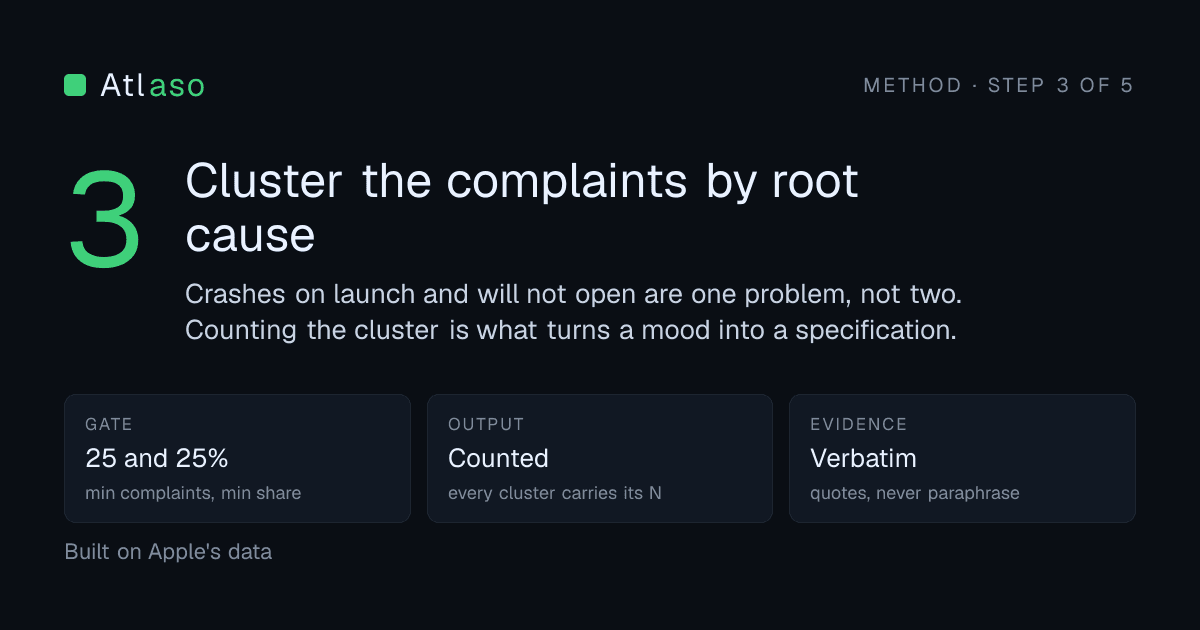
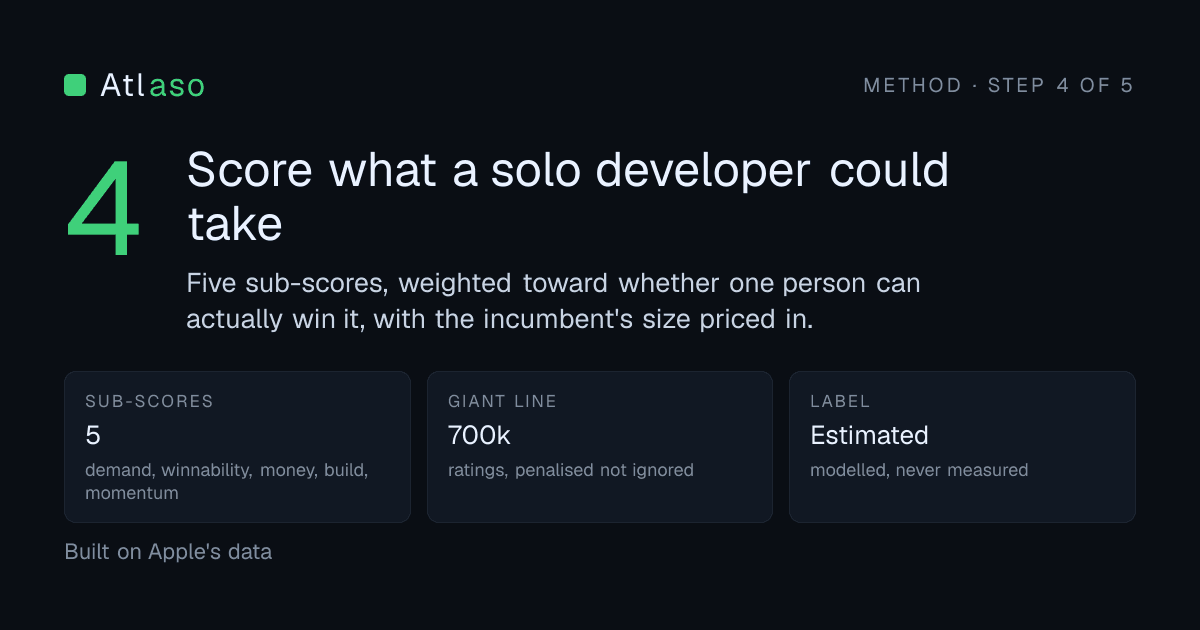
4. Score what a solo developer could take
Every idea is scored on five things: demand, winnability, monetization, feasibility and momentum. The weighting favours winnability, because the question is not whether a market is big. It is whether one person can take a piece of it.
An incumbent above 700,000 lifetime ratings counts as a giant, and that is priced into the score rather than used to quietly hide the idea. Every number is modelled from Apple's own signals and labelled an estimate. We do not have Apple's internal figures and will not pretend the numbers are measured. The full weighting, the giant penalty and the calibration are all published with the live constants.
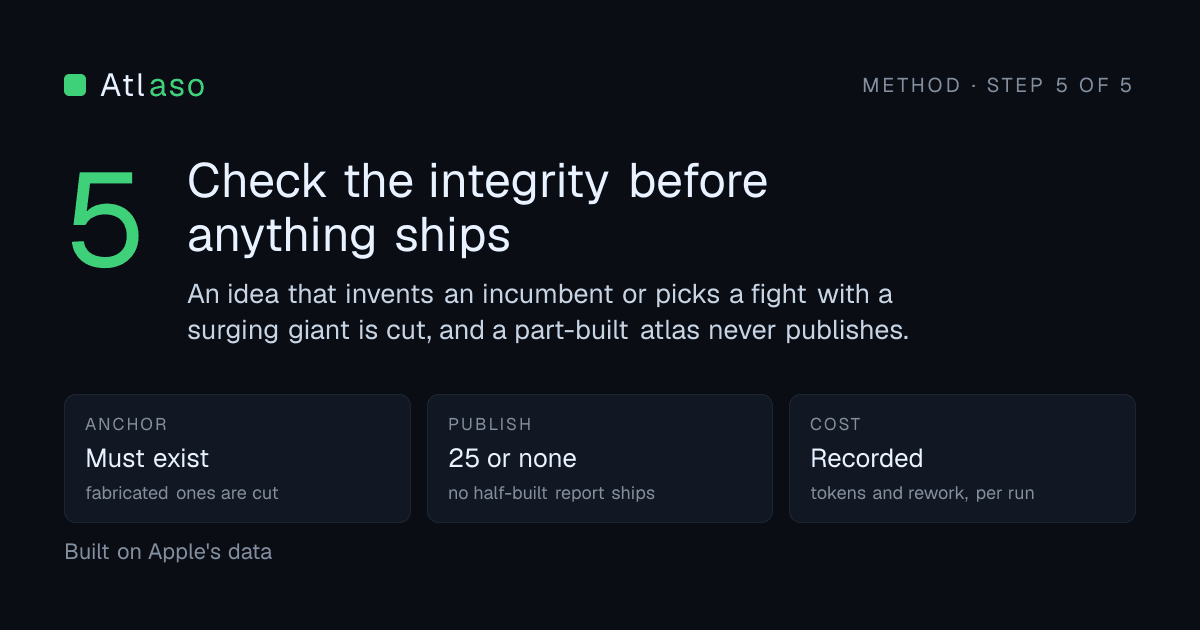
5. Check the integrity before anything ships
Before a run ships, every idea's named incumbent is checked against the apps actually charting. An idea that invents one is cut. An idea attacking an incumbent that is both huge and accelerating is cut too, because that is not a fight a solo developer wins.
Then the run publishes all 25 categories or none of them. A half-built atlas reaching a paying subscriber is the failure that gate exists to prevent. What the run cost to produce is recorded alongside it, tokens and retries included, so a cheap week and an expensive one are told apart rather than averaged.
Check it yourself
One complete run is public and free, all 25 categories across three storefronts, with no account. Every idea in it carries the evidence it was built from, so the fastest way to judge the method is to go and disagree with a specific score.