METHOD
How the opportunity score is built, factor by factor
· 9 min read
Every idea in a Scout run carries a 0–100 score. A score like that is easy to fake and hard to trust, so ours is published in full: the whole engine is on one page, weights included, with a sandbox that runs the production formula live while you drag its inputs.
This post is the written walkthrough of that page, section by section: what each factor measures, why it is weighted the way it is, and where the number is weakest. Every weight and threshold printed here is rendered from the scoring code itself, including the factor cards further down, which are the methodology page's own components dropped into the post.
The shape of the formula
Five sub-scores, one weighted sum, one penalty, then a calibration onto the band you see:
raw   = (0.22·Demand·mv + 0.34·Winnability + 0.16·Monetization·mv
       + 0.18·Feasibility + 0.10·Momentum) × giantFactor
score = raw mapped absolutely onto 40–100
Two properties matter more than the arithmetic. It is deterministic: the same measured inputs produce the same number every time, with no hand-tuning of individual ideas. And the lens is deliberately indie: Winnability alone is a third of the score, while raw market size is not a factor at all. A large opportunity nobody small can take is not, for this audience, an opportunity.
Every sub-score is normalised as a percentile across all 75 category × storefront cells, so a 70 means “better than 70% of lanes”, never a gut feeling. Percentiles are taken 75% against every cell and only 25% against the idea's own storefront: grade a market purely on its own curve and a thin one looks as good as a deep one.
The five factors, as the engine states them
The cards below are the same components the methodology page renders, reading their weights and sub-weights straight from the scoring code. Nothing here is retyped, so a weight change moves this post too. The explanation after each card is the part the card cannot say: why it is built that way.
Winnability is the heaviest, on purpose
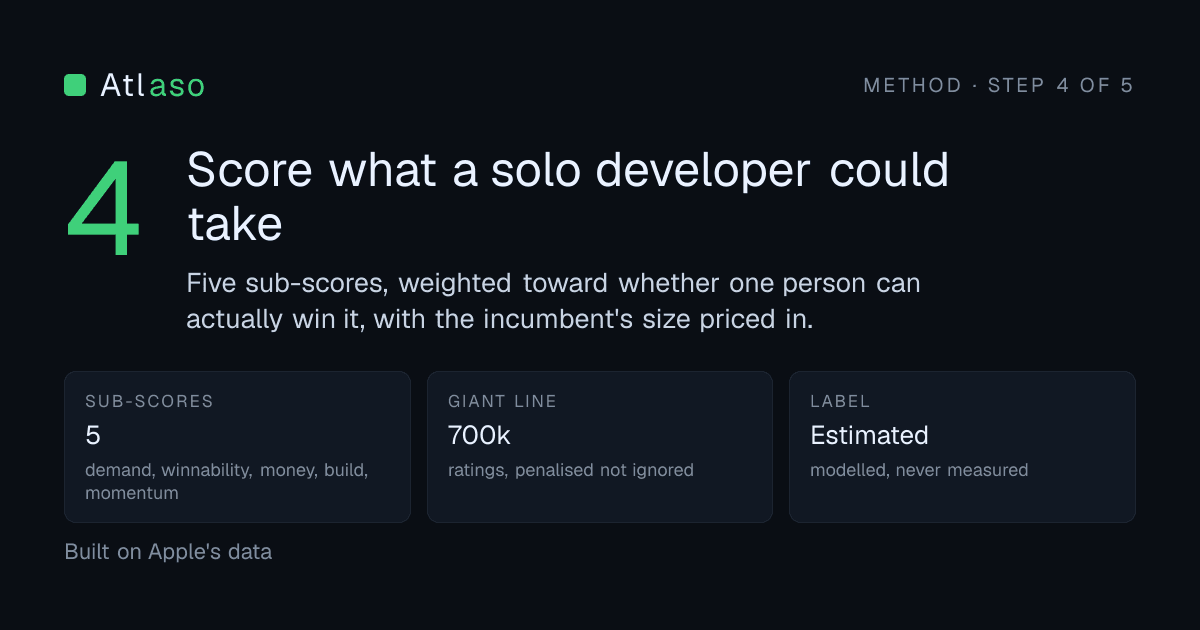
A third of the score sits on one question, whether a small team can take the lane. That is the whole editorial position of the product: an opportunity nobody small can win is not an opportunity for this reader. The dominant input inside it is the leader's size, and the review evidence we mine reaches the score through the leader is hurting slice and nowhere else, damped by how beatable that leader is. Anger at a titan is real but it is an uphill fight, so it is worth less than the same anger at somebody catchable.
Demand pays for the same thing Winnability punishes
Most of Demand is rating growth across the free top 100, fitted by least squares over each app's daily series rather than compared first-to-last, which is why the pipeline wants a month of snapshots and not two. The rest is the leader's size: a big incumbent is proof the market exists. That is deliberately the opposite reading of the number Winnability uses, and the consequence shows up at the end of this post.
Feasibility prices a long build, it does not veto one
One value, taken from the build time the idea committed to. A quarter-long build still scores; it just scores lower than a weekend, by roughly half the factor. For a solo developer the binding constraint is calendar time, not ambition, and the spread between those two values is what that costs.
Monetization asks whether small apps earn here, not whether the category is big
Grossing depth proves the lane monetizes at all, model fit prices how the idea plans to charge, and indie proof counts the small apps already earning in that lane, which is the closest thing to evidence that a newcomer can. Then a run-cost multiplier takes a bite: an idea needing a hundred dollars a month of inference to exist is a worse business than one needing nothing, and the score should say so.
Momentum is acceleration, not headroom
The single most common misreading in the whole report. A grow potential of 0.5 means steady, above means speeding up: it answers “is this lane heating up right now”, never “how much room is left”. An app can be growing hard and decelerating at the same time, and the number will say so.
Then two multipliers on the finished composite
These act on the whole score rather than on one factor, which is why they sit apart. Both cards are live too: the storefront values and the giant ladder are read from the engine, so what you see is what the last run applied.
Market value scales the prize and never the fight. Until it landed, Turkey scored within a point of the US on Monetization, because the engine was answering “does this category monetize relative to its own market”, which is not the question a developer is asking. It is a judgement rather than a measurement, and it is labelled that way on the card: Apple publishes no revenue, so per-market spend cannot be derived from anything we hold.
The giant ladder is the smaller of the two, deliberately. Anchor size has already sunk Winnability by the time an app is that big, so this is a nudge on top rather than a second full penalty, plus a flag on the report, a shaved momentum and a halved reach estimate. Going head-to-head with an entrenched leader is the classic indie mistake, and it is the one thing a scoring engine can talk a hopeful person out of.
Calibration: from raw to the number on the page
Raw composites cluster in a narrow band, so the displayed score is a fixed, absolute map: a raw of 32 reads 40, a raw of 72 reads 100, straight-line in between. Tiers sit at 75 (prime), 62 (strong) and 52 (workable).
Absolute matters. It used to be rank-calibrated, which pinned every run's median to roughly 62 whatever the run actually contained: a weak month read exactly like a strong one. Now the same raw always shows the same score, across categories and across runs, so a run's median moves with its quality. The calibration line is plotted here, and you can drag any raw along it.
The pipeline that feeds it
Scoring is the fifth of six stages. Four are deterministic code; two are judgement calls, and we name which.
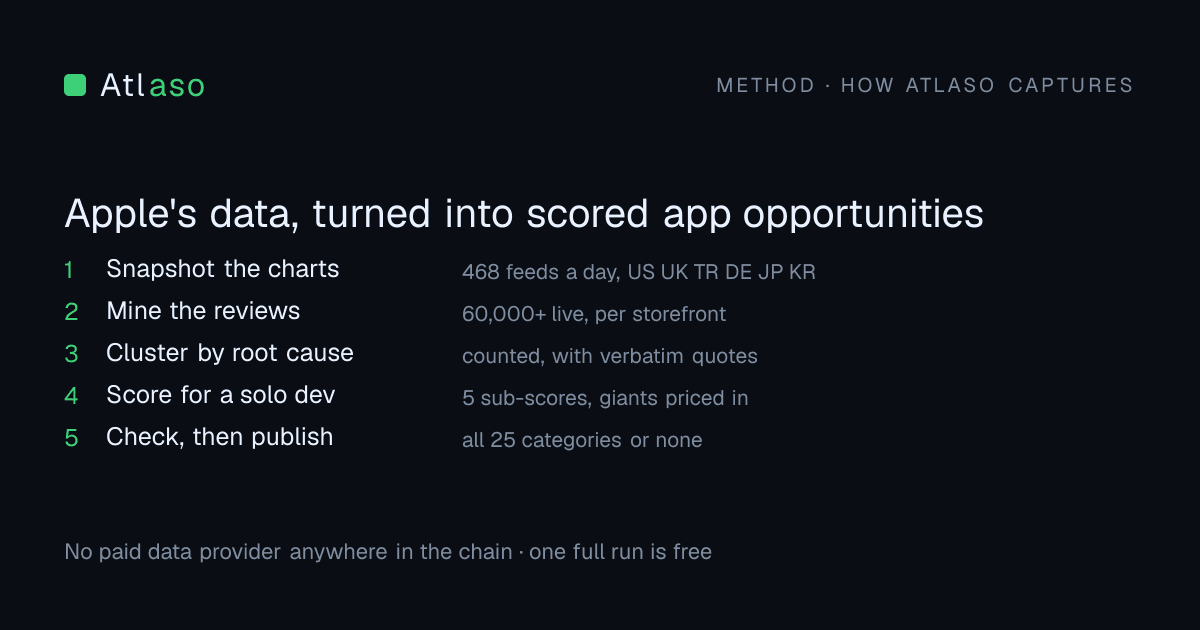
- Extract (deterministic). A month of daily chart snapshots for every category × storefront collapses into one cell of measured signals.
- Reviews (deterministic). Around 200 recent reviews each from the top 10 grossing apps and the top 10 decliners, pulled from that storefront so Turkish complaints about Turkish charts are not missed, then digested down to the evidence an analyst would actually cite.
- Review analysis (one agent). Complaints clustered by root cause, counted, with verbatim quotes and stated sample windows. A leader only survives as an opening past the gate: at least 25 recent reviews at two stars or below, and at least 25% of the sample. These cluster counts are the analyst's own tally and are not independently recounted; the measured figures beside them are copied from the data and are exact. We would rather say that than imply a check that does not run.
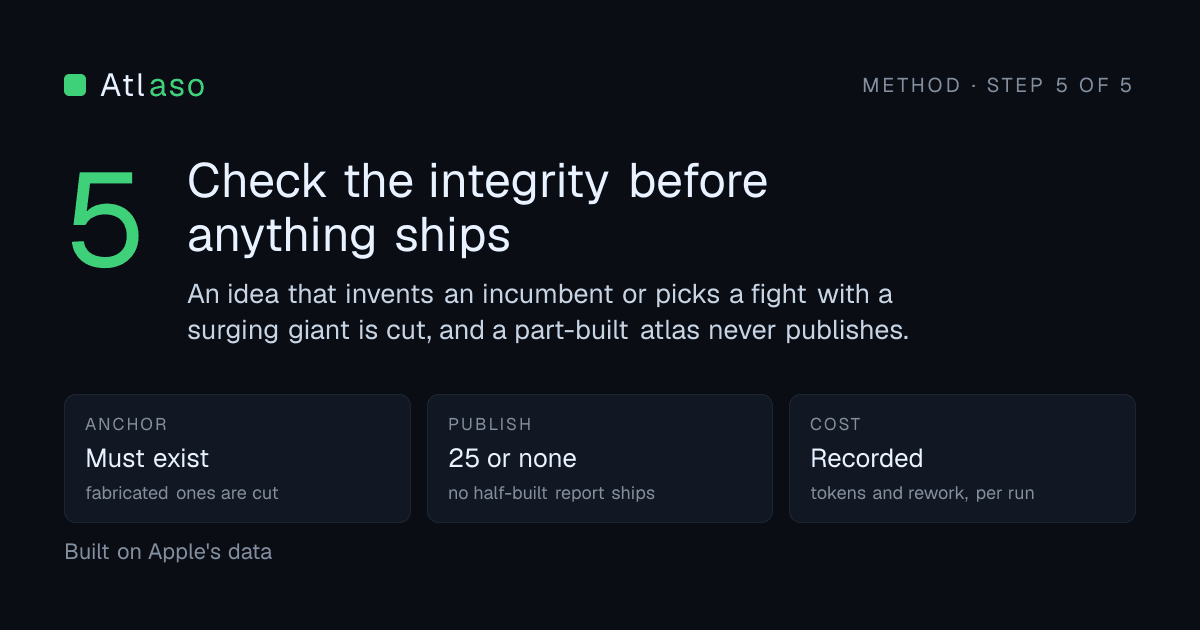
- Ideas (two agents). A strategist writes one idea per genuinely distinct opening, each naming who switches, why now, the complaint it exploits and the exact charted app it competes with. An integrity judge then cuts any idea whose anchor, numbers or effort claim does not hold up, even if that leaves a market thin.
- Score (this engine). Everything above, plus the planning metrics: build time, modelled agency quote, run cost, reach.
- Publish (deterministic). The scored Markdown is committed and mirrored into the database, and that mirror is what the report page reads. It ships all 25 categories or none of them.
Where the numbers come from
All first-party, all from Apple's own public endpoints: daily chart snapshots across every category and seven storefronts, the lookup API for app metadata and rating slides, and the live customer-reviews feed for the charting leaders. No paid data provider, no bought-in download estimates. The signals are listed one by one, with their sources, on the page.
Two things Apple does not publish, and neither do we pretend to: revenue and search volume. Anything derived from those is labelled an estimate everywhere it appears.
Where the score is weakest
A methodology that only explains its formula teaches you to trust it further than it deserves. Three limits, all of them structural:
- Reviews shape the idea; charts set the score. Mining reviews is the slowest, most expensive stage, and it is what gives an idea its wedge. But it reaches the score through exactly one term, capped at 12.2 of 100 points, and near 4.3 against a giant. Read the score as “how winnable”, never as “how strong is the evidence”.
- Some ideas have no measured leader. When the strategist names no single charted app to take the lane from, Winnability falls back to a flat 0.55 beatable prior. That is a default, not a finding. Trust an anchored score far more, and check which app it names before you read the number.
- Demand and Winnability pull against each other. Demand pays for a big anchor, Winnability for a small one, so no idea can max both. The arithmetic ceiling lands in the low 90s (the methodology page prints it exactly, derived from the live constants), at a corner that cannot exist. A mid-70s score is not mediocre; it is near the practical top of the scale. Judge an idea against the month's field, never against 100.
Those three are measured against the current run on the methodology page, so the percentages there are live rather than illustrative.
Go and break it
The most useful thing on the methodology page is the sandbox. Take a real idea out of the current run, watch its score rebuilt from its five sub-scores step for step, then switch to the sliders and move the engine's actual inputs: leader size, negative-review share, churn, build time, storefront. Every dial is a real term in the formula and none is decorative.
Then read a complete run for free and check the scores against the ideas they belong to. That is the point of publishing the engine: a score you cannot audit is just a number somebody chose.